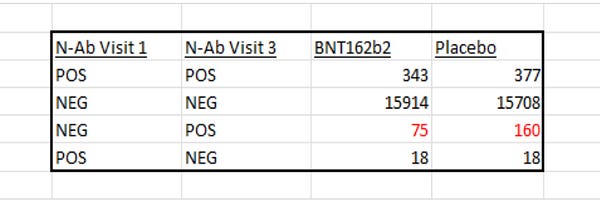
Whilst I work on explaining what this data even is, I believe it’s probably valuable that I just post this now.
Put simply, what JikkyLeaks claimed, was that deep within the ‘adva’ file which was released as part of the Pfizer Documents, was data showing the N-antibody status of the Pfizer trial participants. Those who were NEGATIVE at Visit 1 and then POSITIVE at Visit 3 had gone on to contract Covid-19 during the trial, and as such, this is another way of measuring the efficacy of the vaccine. We didn’t have this data until the Pfizer Documents were released.


The numbers Jikky posted suggested that 160 patients in the placebo group vs 75 in the vaccine group went on to contract Covid-19 during the trial. This would downgrade Pfizer’s vaccine efficacy to 53%, contradicting the 95% efficacy claim.
Before we can even get into what this means, it seemed to me that what was required was a way to verify that these numbers even exist. If they exist, do they count to the numbers Jikky claims? There are a number of things that stand in your way if you wanted to check the numbers for yourself. It’s not exactly straightforward to:
Know the data even exists
Find this particular data once you realise the data exists
Know what each of the particular datasets mean
Get the data machine-readable so it can (sort of) be queried
Run an algorithm to count the patients in the way JikkyLeaks claims they can be counted.
To add to this, I can’t exactly talk about this case if I can’t confirm/debunk those numbers for myself. So that’s what I decided to do.
To get this to work, I first used the .csv file that JikkyLeaks posted at this link. I pulled the file into Pandas, and after a few false starts, and some wrangling of the dates in the ‘ADT’ column, I was able to arrive at the exact same numbers as JikkyLeaks.
But how can I know for sure that the file JikkyLeaks posted hadn’t been modified in some way? The next stage was to take the ‘adva’ file in its raw ‘straight from Pfizer’ .xpt format. It’s hosted at the original phmpt.org website, and if you search ‘adva’ you’ll see it there with a .zip (.xpt) extension.
After cleaning it up, again, I could reach the same results shown in the original JikkyLeaks post. 160 patients in placebo vs 75 in the vaccinated.


The code is available on github, and if you’ve ever used Python and Jupyter Notebooks it should be easy to run. In just five blocks of code, you’ll see how we can go from the original Pfizer documents to the numbers shown above.
If people are interested and capable, additional queries of the data should now be possible by adding to this initial codebase. My intention in posting it is so that other people can run the code and check it themselves. It might also be useful to others working on this, and it might inspire some people to get involved in looking at the data for themselves.
https://github.com/philmade/pfizer_docs
As ever, shares with people who might be interested in this are greatly appreciated, and if this is useful to you, please do consider becoming a subscriber.


Great work, once more!
There's one thing I'm not sure, because I'm not an immunologist: does the fact that only 53% less people in the vaccinated group had developed N-antibodies *prove* a lack of efficacy?
The fact people had N-antibodies proves they *met* the virus, but what does it say about their protection? Even if the vaccine had perfect efficacy in protecting people, couldn't (shouldn't) their immune system build N-antibodies after meeting the virus, even though vaccine-induced S-antibodies were doing the job getting rid of the virus?
I remember reading a paper explaining that Moderna's Covid vaccine seems to prevent people who get breakthrough infections from building proper N-antibodies that would strengthen their immune response for next time they meet a SARS-CoV2 virus. So maybe this 53% reduction of N-antibodies in vaccinees was the result of the impairment of the sane reaction their immune system should have had meeting a virus ?
https://www.medrxiv.org/content/10.1101/2022.04.18.22271936v1
Another way of asking: with a really perfect vaccine, should the reduction in the number of patients with N-antibodies be 100% or 0% in comparison to the placebo group?
Terrific work, thank you. But where on Earth are the original data of 8 and 162, from which so much was inferred by so many for so long?? Are they in fact 75 and 160 or is there another location of those data?